Welcome to the Github page for the bisilhouette package.
To install this package in r you can do the following:
devtools::install_github("eso28599/bisilhouette") # requires devtools package to be installedDescription
The bisilhouette score is an extension of the silhouette score to the bicluster case. It is a measure of the quality of a biclustering, which like the silhouette score takes into account the compactness and separation of the biclusters.
This page details the use of the functions within the bisilhouette function, for more details on the definiton of the score, please see the package vignette.
Examples
We ilustrate the use of the bisilhouette function which takes as input the data matrix, and bicluster membership informtation encoded via row_clustering and col_clustering.
-
row_clusteringis a binary matrix which contains 1 in element [i,j] if row i is in bicluster j -
col_clusteringis a binary matrix which contains 1 in element [i,j] if column i is in bicluster j
data <- matrix(rnorm(50), nrow = 10)
row_clustering <- cbind(
  rbinom(10, 1, 0.5),
  rbinom(10, 1, 0.5),
  rbinom(10, 1, 0.5)
)
col_clustering <- cbind(
  rbinom(5, 1, 0.5),
  rbinom(5, 1, 0.5),
  rbinom(5, 1, 0.5)
)
bisil <- bisilhouette(data, row_clustering, col_clustering)
bisil$bisil # the bisilhouette score
bisil$vals # a list containing vectors of the bisilhouette coefficients for each bicluster
The bisilhouette package is compatible with the output of functions from the popular biclustpackage; if Biclust is the object returned by the biclust function from the biclust package, bisilhouette can be used as followed:
bisilhouette(data, Biclust@RowxNumber, Biclust@NumberxCol)Visualisation
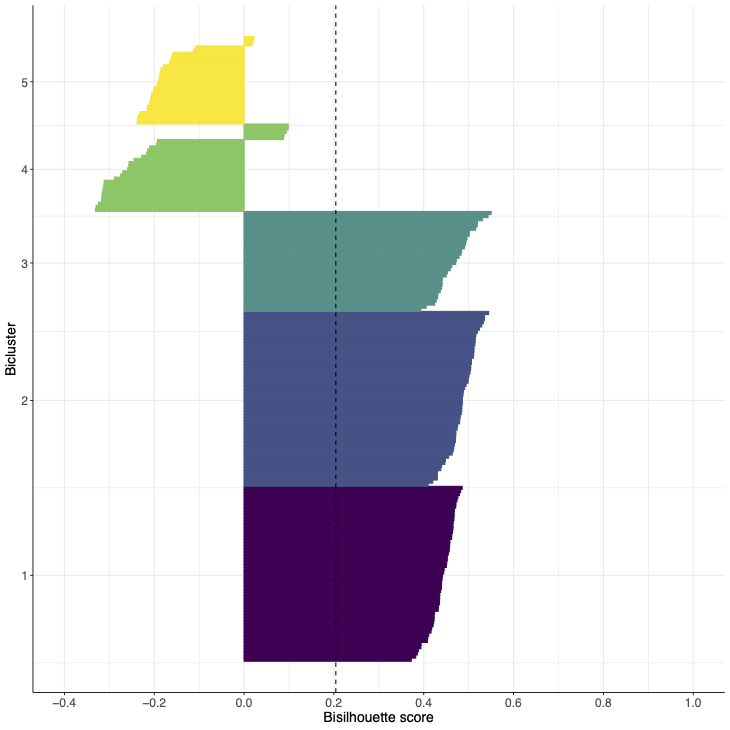
The function plot_bisil produces a visualisation of the bisilhouette scores. The individual bisilhouette coefficients for each of the rows is shown along the x axis, with rows grouped into the assigned biclusters (denoted by different colours). The mean coefficient is represented by the dashed line.
bisil_plot(data, row_clustering, col_clustering)Examples
- Bisilhouette plot for synthetic data with 3 views and 5 biclusters using the true column clusters and 3 out of 5 of the correct row clusters with the remaining row clusters having been reassigned randomly.
- Bisilhouette plot for biclusters obtained from a single cell transcriptomic dataset.
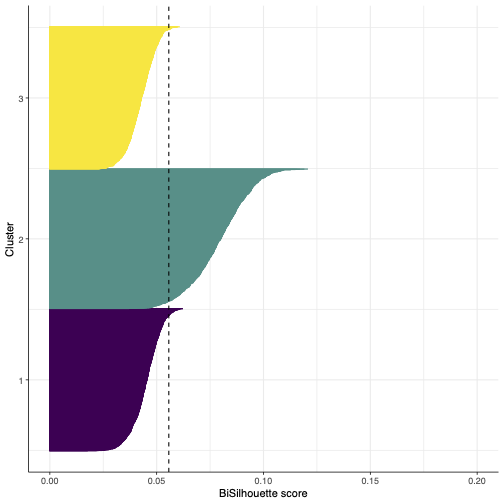
Note that the axes ranges are different as the bisilhouette score is not comporable across distinct datasets.
If you use this score in your work please cite: Orme, Ella S.C., Theodoulos Rodosthenous, and Marina Evangelou. “Multi-view biclustering via non-negative matrix tri-factorisation.” arXiv e-prints (2025): arXiv-2502.